Prognostic and diagnostic Modelling
Background
I’ve worked principally on analyses of patient samples from two nationwide myeloma trials
Myeloma-IX (1,977) and Myeloma-XI (4420 participants), where the majority of patients
receive an IMID, thalidomide or lenalidomide. The trials were further stratified by patients receiving an autologous transplant (younger and fitter) and those
who did not receive a transplant and received attenuated induction therapy (older and frailer). This effectively gave eight overlapping treatment arms for which
I carried a number of studies to associate clinical outcomes with biomarkers.
An appraisal of clinical demographics and integrated with available -Omics in the subset of patients under consideration was always the first step to any analysis.
I would carry out an SQL query to the latest cut of the trial clinical demographics (over 80-100 variables. depending on the coding approach) and place this as
data-frame in R and merge with data-tables of -Omics data in R. Where I would create a complete set with no missing data, by dropping cases, normalising,
recoding and/or imputing when appropriate. I've typically imputed across single data types. Importantly, these data would contain orthologous methods of typing markers,
therefore at this point in the analysis, I would find discrepancies and amend with the appropriate data trail. I am aware of the progress in tackling these approaches
with machine and deep learning, I have been contrasting best performers in "Multi-Omics Sample Mislabeling Big Data Challenge" to my previous datasets to understand
alternate approaches i.e. Spike-and-Slab Lasso Generalized Linear Models. I would typically carry out data visualization of the remaining data, followed by univariate cox analyses
to identify anomalies. In order to select covariates for modeling I have previously applied linear (ridge regression, lasso, elastic net) and non-linear regression/classification
techniques (e.g. KNN, random and random forest) using R (glmnet and XG Boost) and python (SciPy) packages. I can also translate these approaches to Scikit-Learn, Keras and
Tesorflow 2.0, especially important for non-linear models. I would typically mirror this analysis in independent sets, generally from public databases. Synchronization of replication
sets can be particularly challenging as demographics and QC processing information can missing, again typically I will use data visualization and meta-analysis approaches to tackle these
issues.
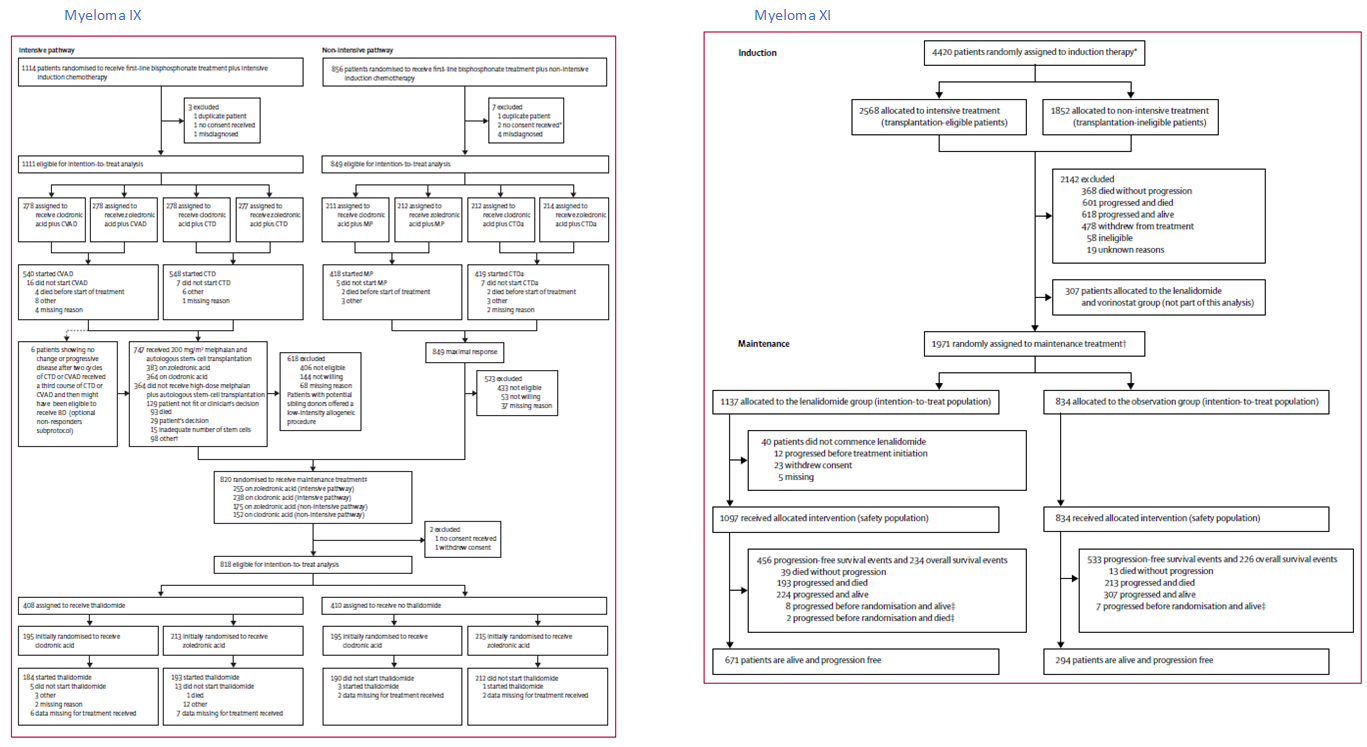
Below, are consort diagrams for myeloma IX (left) and myeloma XI, both contain maintenance arms, the effects of which were also considered in analyses.
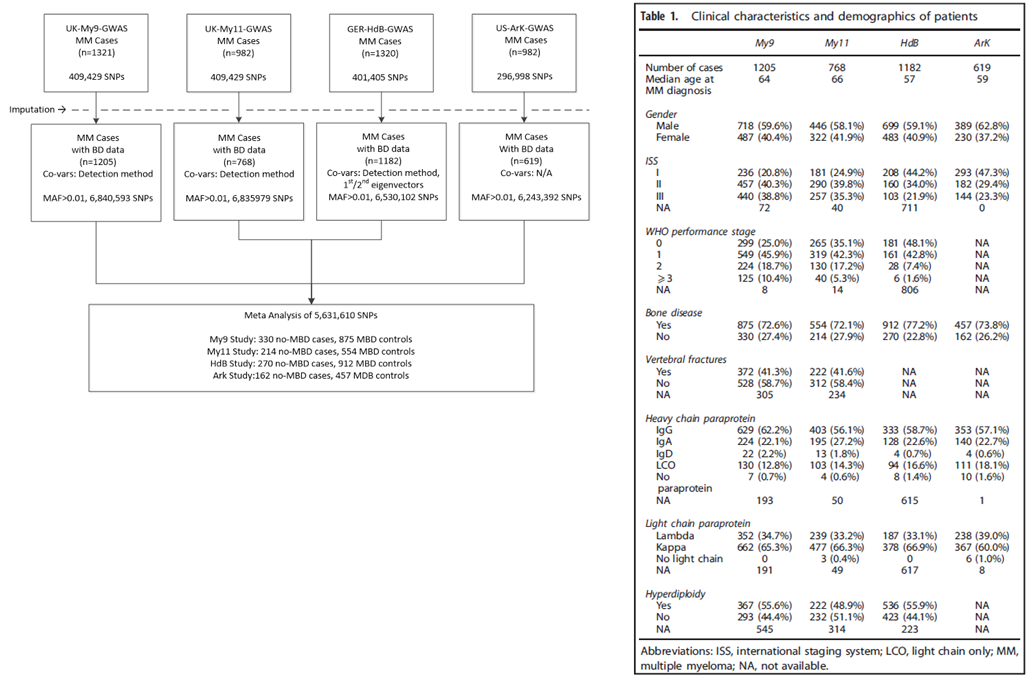
Bone disease
Owing to the differences in sensitivity of the radiological methods used to detect MBD, patients were classified as either
affected (MBD) or unaffected (no MBD). In the UK cohort, I did this by building a matrix of all available bone-related demographics, that included adjusted
serum calcium levels bone surgery, axial or/and vertebral fractures, number of bones lesions in addition to general clinical demographics.
MBD was detected using axial survey in My9 and My11, axial skeletal survey (2001–2010) and whole-body computed tomography (2011
onwards) in German and combined skeletal survey and skeletal computed tomography in the US. The frequency of MBD was marginally higher in
the HdB cohort, perhaps surprisingly age was not significantly associated with MBD in any of the four cohorts.
Below, on the right is a breakdown of the datasets and analyses of the bone disease GWAS study with the clinical characteristics on the left.
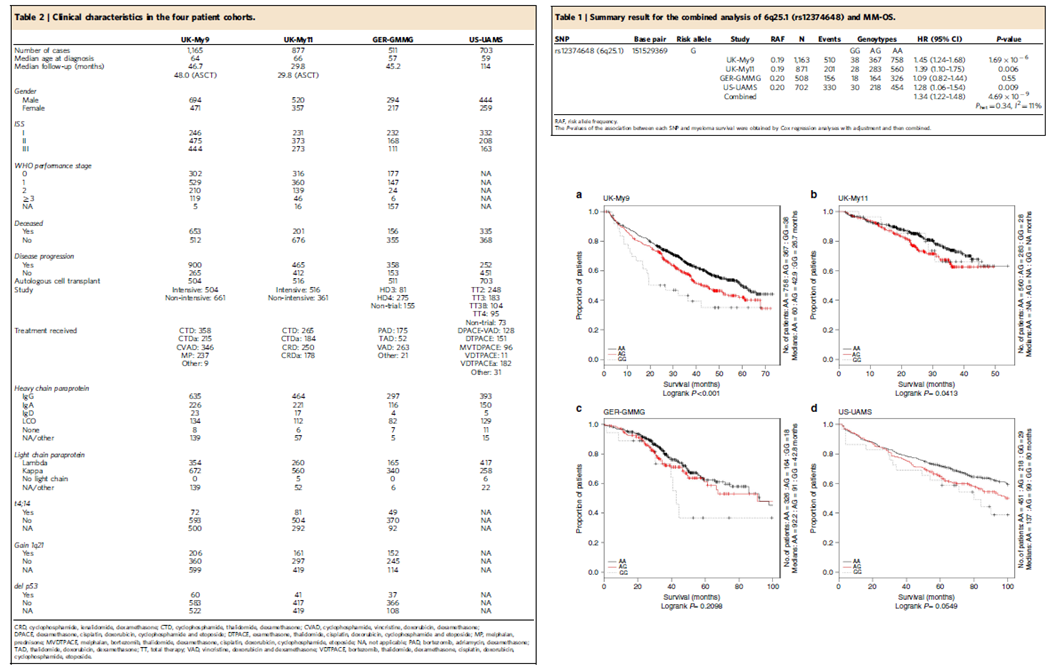
Survival GWAS
Survival GWAS reports are rare in the literature and at the date of publishing, this MM analysis was the largest GWAS survival analysis in the literature at the time. Heterogeneity
in the patients-group is a key hurdle to performing a Survival GWAS. In this analysis, there was the advantage that all patients was enrolled in large clinical trials, so that
there was a consistency in treatment across the individual studies, and comprehensive trial standard demographics allowing covariant identification. Considerable time was
spend on data cleaning, removing patients whose treatment varied from protocol, removal of population outliers. Each trial was modelled separately due to particular aspects of each trial.
For example, lasso approaches identified age as a covariate in the US study, whilst in contrast, the german patients were all young and the impact of age was translated in the treatment
covariate in logistic regression association tests with genotypes.
Below, on the right is the clinical characteristics of the Survival GWAS study, on the left is the association results for sentinel SNP at 6q25 along with Kaplan-Meier curves
for each patient cohort.
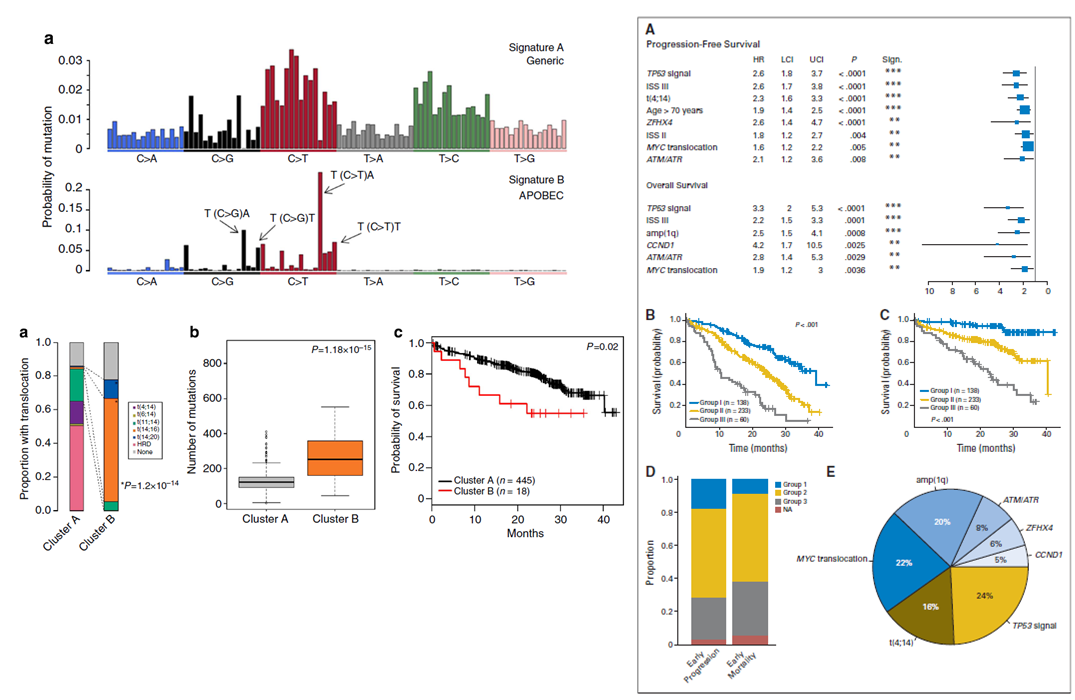
Exon sequencing prognosis
The difficulty in assessing prognosis in Cancer sequencing studies treatment heterogeneity and the complexity of chromosomal aberrations we sort to examine this in two linked
analysis, the first focused on mutational-signatures and primary events and second focused on
SNVs. In the first manuscript, we showed outcomes to be influenced by not only primary translocations,
but also secondary MYC translocations, global effects such kataegis and an APOBEC mutational signature. In the second analysis the correlation between mutated genes
and cytogenetic abnormalities were determined using Bayesian inference with JAGS and the R-based Bayesmed. All somatic events were annotated using both SnpEff and Oncotator.
Recurrently mutated genes with defined and selected prognostic analyses using MutsigCV. Mutations Differences between survival functions were tested using the log-rank
test. Hazard ratios (HRs) were estimated from Cox proportional hazard regression. Multi-variable stepwise variable selection was performed using a standard backward-elimination
approach.
Below, on the right shows the mutational signature distribution across all samples and the survival impact of APOBEC mutational signature enriched in cluster B. On the left
show univariate results and combined survival results when grouping high-risk chromosomal legions.
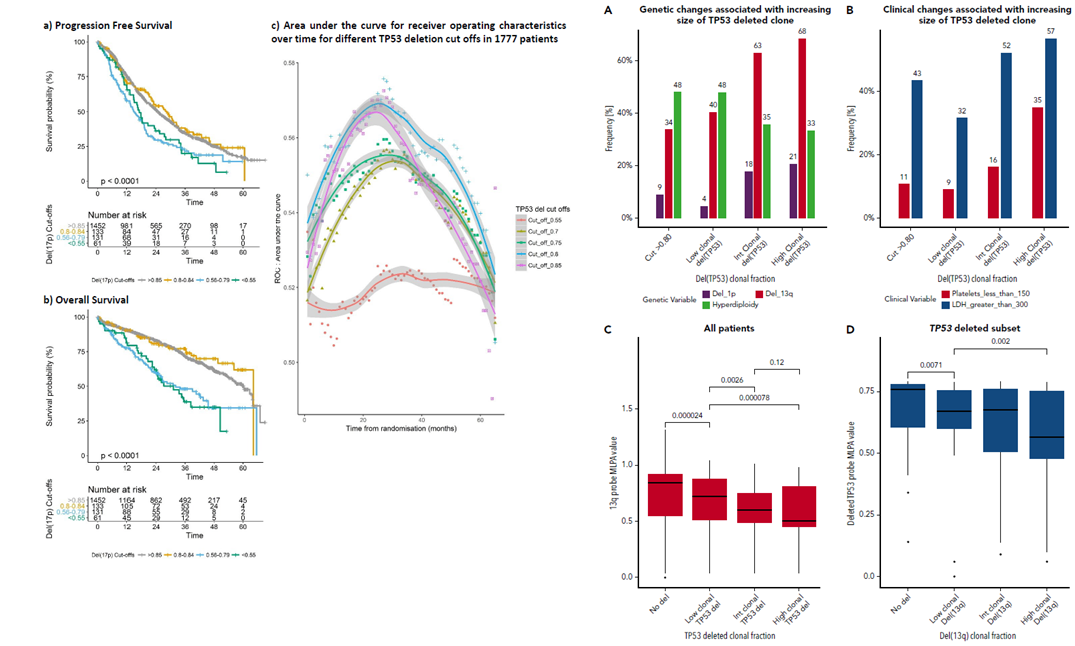
TP53 copy number assessment by MLPA
We had previously presented an integrated outcome analysis of copy number status by molecular ligation probe assay (MLPA) and exon sequencing.
In a follow-on analysis focussed on TP53, we examined series of thresholds for TP53 deletion status using three alternate methods: C-statistics for risk prediction models with censored survival data, classic multi-variant analysis, and ROC assessment.
WGS sequencing prognosis
An approach I have considered to link prognostic questions to WGS would be to infer eQTL or meQTL/pQTL supported Mendelian randomization instrumental variables (IVs) to model transcription and translational
output from each WGS profile to give a relative functional output for each gene for each patient. Thresholds for functional output per gene could be binarised (statistical or/and by approximating to known functional evidence)
and used interrogate survival outcomes and responses. Using disease type or subtype (inferred from the global subtype signatures, by considered inferred transcription or translation combined), together with appropriate clinical
demographics (age, gender, disease stage, etc, would allow single gene survival outcomes to assessed. Scaling to pathways to consider particularly targeted therapies would also be possible with this approach.
Programs and packages
Covariate selection - glmnet, dygraphs, rpart, statisticalModeling, survivalROC, PyPI, PYyMC3 and NetworkX; Association testing - PLINK versions 1.7, 1.8 and 1.9 and SNPTEST; Meta-analysis - PLINK, META, METAL; Machine learning - glmnet, recipes, XGBoost, caret, Scikit-Learn, Keras and Tesorflow 2.0.
Bayesian inference - JAGS, Baysmed; Survival analysis - survival, survC1; Sequencing analysis - SnpEff, Onctotator, MutsigCV. Data-visualisation - ggplot2, matplotlib.
References
◦ Sub-clonal TP53 copy number is associated with prognosis in multiple myeloma. Shah V, Johnson DC, Sherborne AL, Ellis S, Aldridge FM, Howard-Reeves J, Begum F, Price A, Kendall J, Chiecchio L, Savola S, Jenner MW, Drayson MT, Owen RG, Gregory WM, Morgan GJ, Davies FE, Houlston RS, Cook G, Cairns DA, Jackson G, Kaiser MF. Blood. 2018 Oct 29. PMID: 30373884
◦ Prediction of outcome in newly diagnosed myeloma: a meta-analysis of the molecular profiles of 1905 trial patients. Shah V, Sherborne AL, Walker BA, Johnson DC, Boyle EM, Ellis S, Begum DB, Proszek PZ, Jones JR, Pawlyn C, Savola S, Jenner MW, Drayson MT, Owen RG, Houlston RS, Cairns DA, Gregory WM, Cook G, Davies FE, Jackson GH, Morgan GJ, Kaiser MF. Leukemia. 2018 Jan;32(1):102-110. PMID: 28584253
◦ Genome-wide association study identifies variation at 6q25.1 associated with survival in multiple myeloma. Johnson DC, Weinhold N, Mitchell JS, Chen B, Kaiser M, Begum DB, Hillengass J, Bertsch U, Gregory WA, Cairns D, Jackson GH, Försti A, Nickel J, Hoffmann P, Nöethen MM, Stephens OW, Barlogie B, Davis FE, Hemminki K, Goldschmidt H, Houlston RS, Morgan GJ. Nat Commun. 2016 Jan 8;7:10290. PMID: 26743840
◦ Mutational Spectrum, Copy Number Changes, and Outcome: Results of a Sequencing Study of Patients With Newly Diagnosed Myeloma. Walker BA, Boyle EM, Wardell CP, Murison A, Begum DB, Dahir NM, Proszek PZ, Johnson DC, Kaiser MF, Melchor L, Aronson LI, Scales M, Pawlyn C, Mirabella F, Jones JR, Brioli A, Mikulasova A, Cairns DA, Gregory WM, Quartilho A, Drayson MT, Russell N, Cook G, Jackson GH, Leleu X, Davies FE, Morgan GJ. J Clin Oncol. 2015 Nov 20;33(33):3911-20. Epub 2015 Aug 17. PMID: 26282654
◦ Implementation of genome-wide complex trait analysis to quantify the heritability in multiple myeloma. Mitchell JS, Johnson DC, Litchfield K, Broderick P, Weinhold N, Davies FE, Gregory WA, Jackson GH, Kaiser M, Morgan GJ, Houlston RS. Sci Rep. 2015 Jul 24;5:12473. PMID: 26208354. PMID: 26208354
◦ APOBEC family mutational signatures are associated with poor prognosis translocations in multiple myeloma. Walker BA, Wardell CP, Murison A, Boyle EM, Begum DB, Dahir NM, Proszek PZ, Melchor L, Pawlyn C, Kaiser MF, Johnson DC, Qiang YW, Jones JR, Cairns DA, Gregory WM, Owen RG, Cook G, Drayson MT, Jackson GH, Davies FE, Morgan GJ. Nat Commun. 2015 Apr 23;6:6997. PMID: 25904160
◦ Neutral tumor evolution in myeloma is associated with poor prognosis. Johnson DC, Lenive O, Mitchell J, Jackson G, Owen R, Drayson M, Cook G, Jones JR, Pawlyn C, Davies FE, Walker BA, Wardell C, Gregory WM, Cairns D, Morgan GJ, Houlston RS, Kaiser MF. Blood. 2017 Oct 5;130(14):1639-1643. PMID: 28827410.
◦ The Elements of Statistical Learning - Data Mining, Inference and Prediction - Hastie T, Tibshirani R and Friedman J.
◦ Applied Predictive Modeling - Kuhn M and Johnson K.
◦ Deep Learning - Goodfellow I, Bengio Y and Courville.
◦ Deep Learning in R - Chollet F and Allaire JJ.